Scraping Amazon product information
In this lesson, I’m going to fetch data from amazon. However in the future we will cover this example in depth, and I will teach you how to use the M formula language and how to create function to be able to view the page in a dynamic manner.
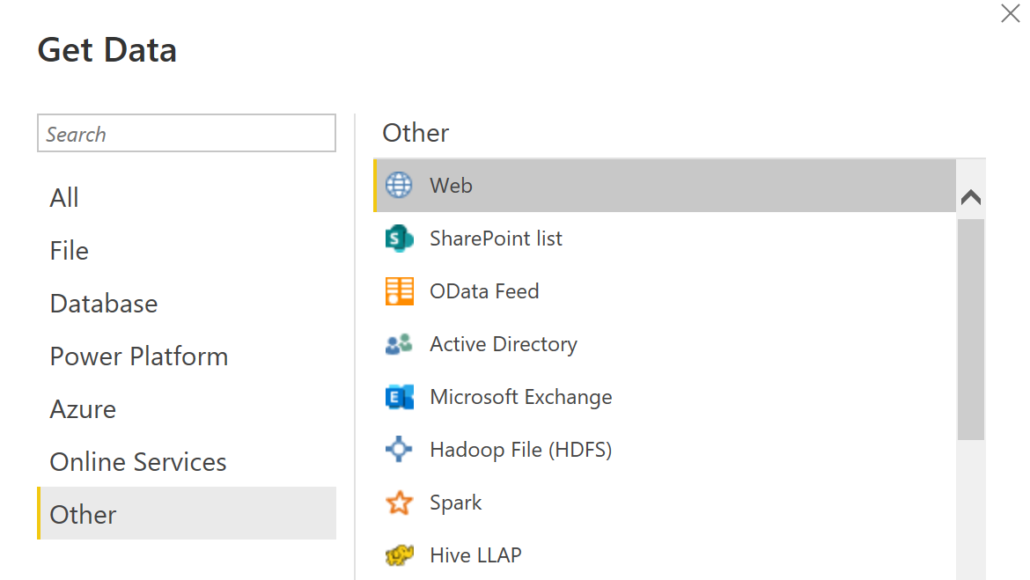
First, let’s run power bi and click the get data button, here you can view data source list which provides many options to choose from, for instance: excel, pdf, and Facebook,…
In this example we select web.
We paste an amazon link , that was copied from the browser now we patiently wait until the data is fetched.
https://www.amazon.com/s?i=specialty-aps&bbn=16225007011&rh=n%3A16225007011%2Cn%3A1292110011&ref=nav_em__nav_desktop_sa_intl_data_storage_0_2_6_5
You can view that power bi has extracted two tables .
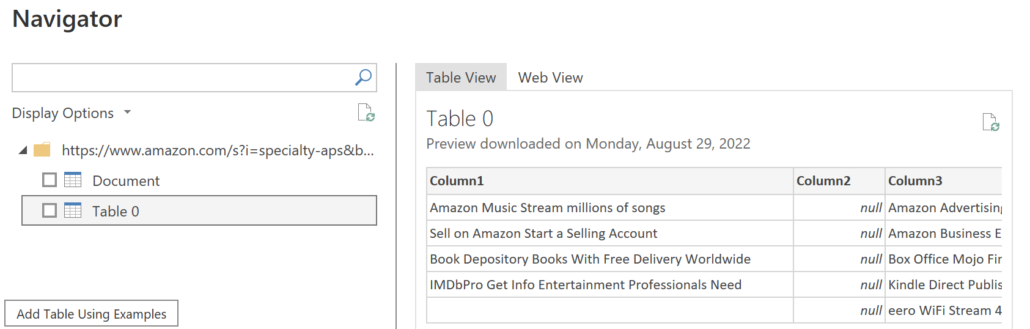
Let’s go over and see what is in those tables.
So neither of these data satisfies us. They are irrelevant.
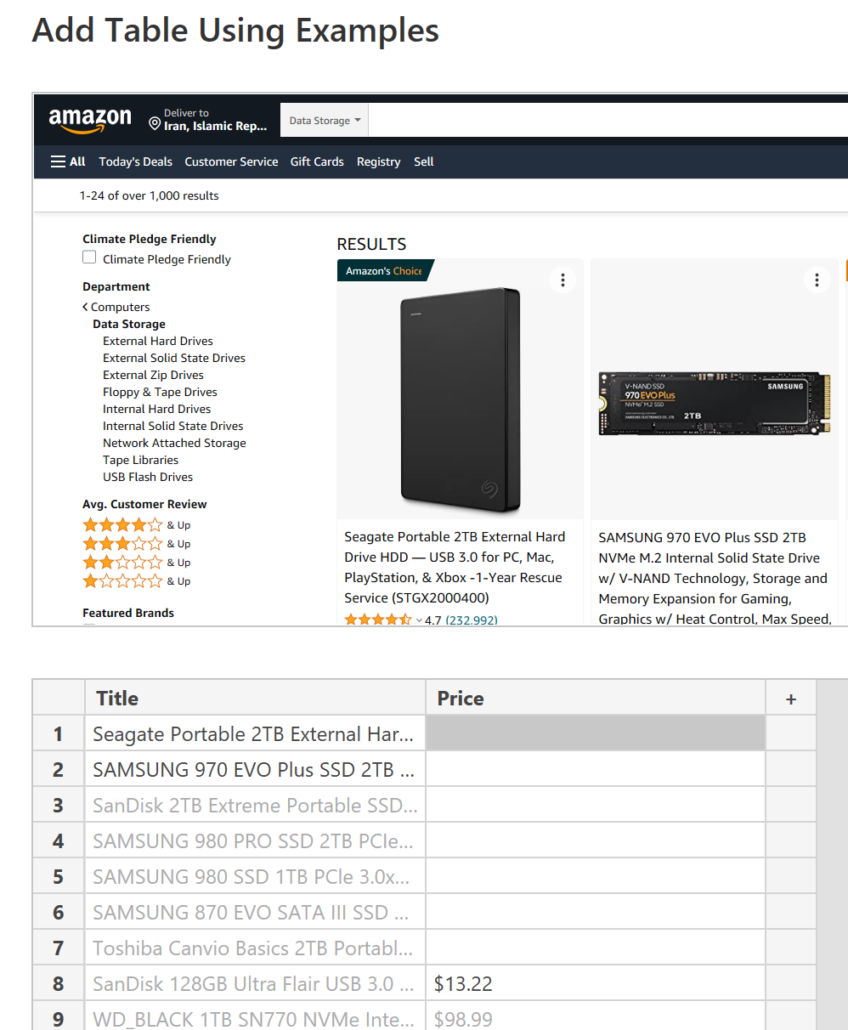
By the add table using button , we are able to customize our table via/through CSS class.
Ok let’s see how we can fetch data using this method.
On the amazon web page, right-click on an element, in this step it’s the title, then click inspect and then select the needed values which we will need to paste to power bi, from here, you can see that power BI automatically fills the rest of the columns with the rest of your needed values.
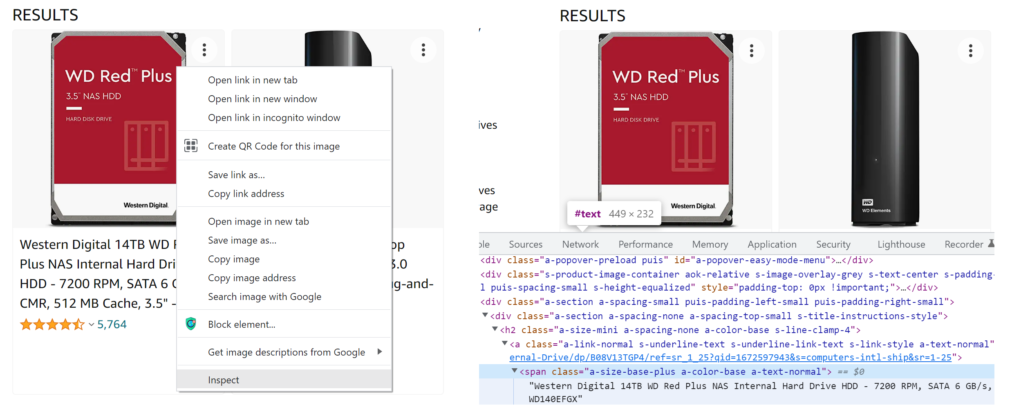
and then
Now let’s go over and insert the prices, again we right click on the price and then inspect, copy paste the values into power bi.
Do the same for the images and ranking.
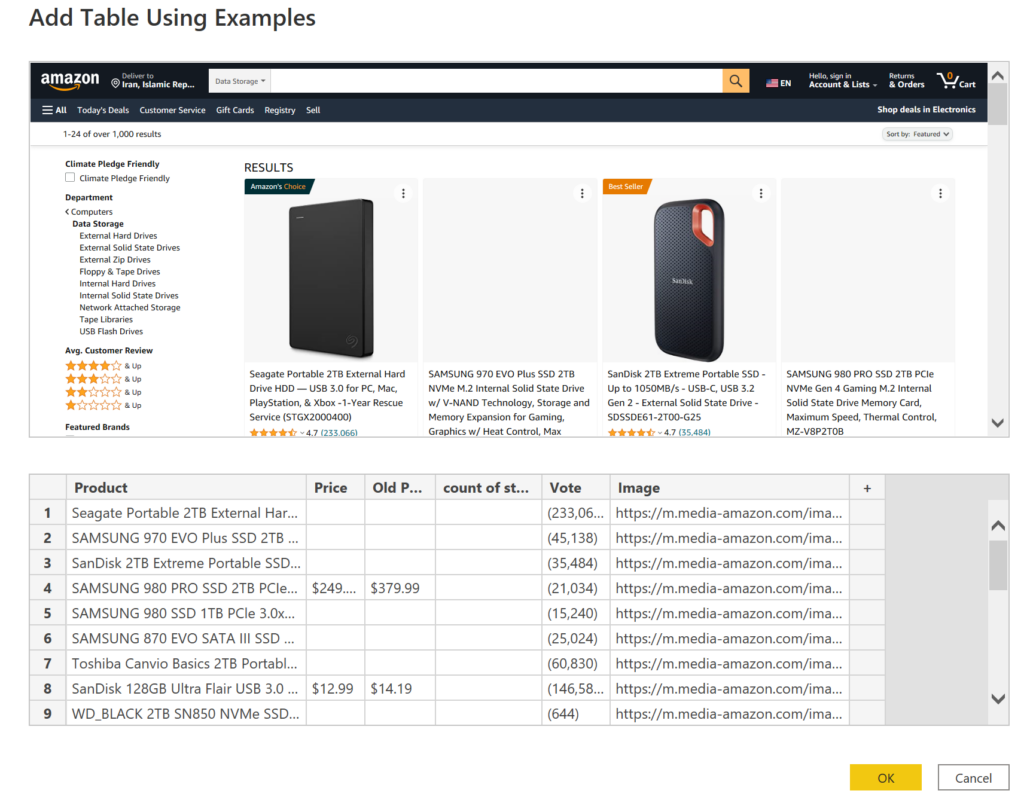
Look ! that’s great isn’t it. And plus we haven’t even reached the transformation yet.
So, click the ok button, the data in amazon is clean enough, we don’t need to transform the data.
We wait until all of the data is fetched, then we drag and drop a table on the screen , and then we insert the desired fields.
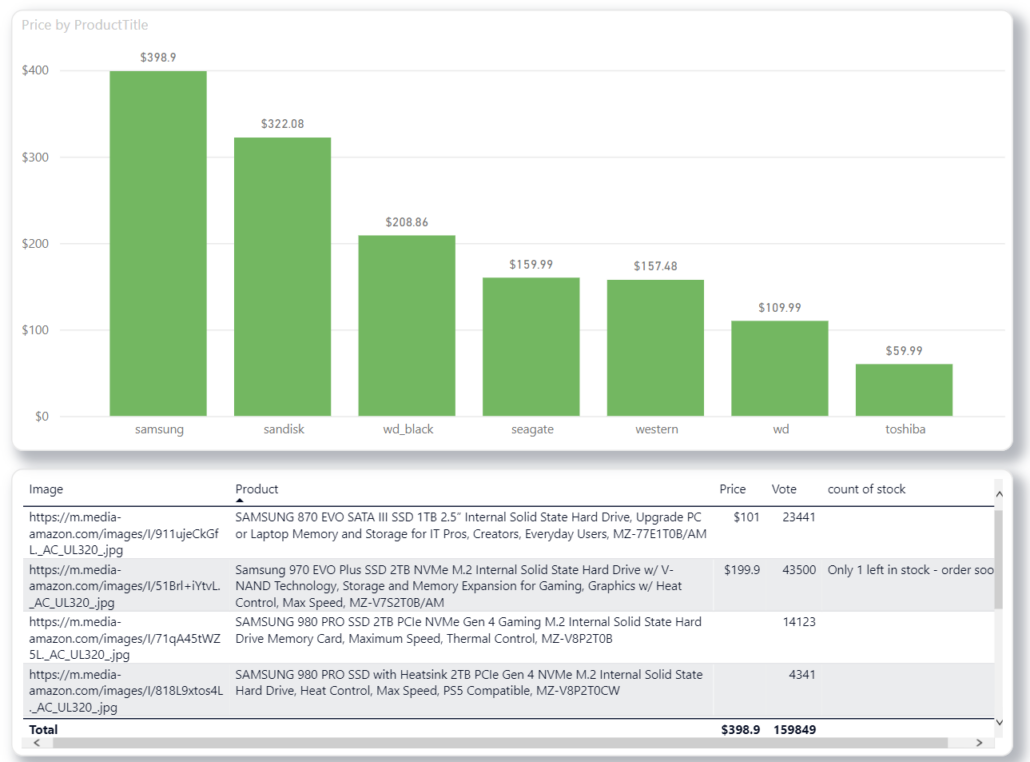
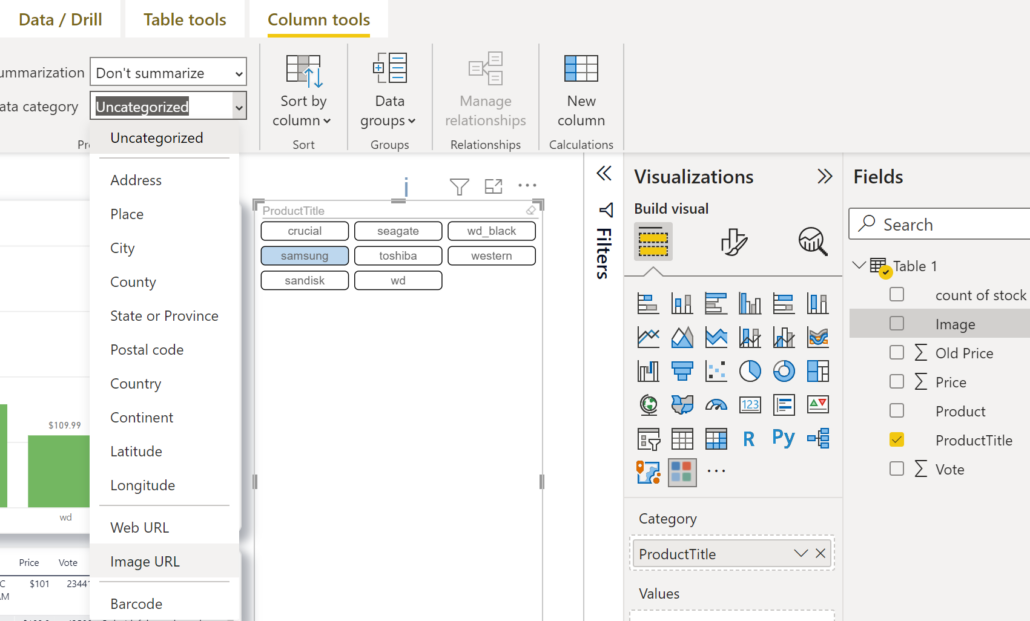
You can view your table but the images aren’t the way we want them to be.
In order to fix this, select the image field, then go to column tools, and then change the data category to image URL. Now you can view the images properly.
I wish that, this example was interesting and useful.

I have been working as a senior Business Intelligence Developer such as (Microsoft BI Services, QlikView, Qlik sense, and Power BI) since 2007, what’s more, I have been teaching BI courses such as (QlikView, Qlik Sense, Power BI, and SSRS) for 8 Years.
I want to address that I have been a consultant in various companies such as (Pharmaceutical corporates, port and maritime, insurance companies etc.).
I am capable of covering tasks such as (data cleansing, Designing dashboards, and KPI identification, and also I am well experienced in mentioned fields.
I have studied software engineering for 4 years bachelor’s degree In addition , I have published two books about business intelligence (QlikView with business intelligence approach, organizational key performance indicator)
I have passed the MCT and MCSA courses and I have been qualified for them.


Leave a Reply
Want to join the discussion?Feel free to contribute!