Power BI Process Flow
I’m going to compare and contrast the power BI report server and Power BI service to create and publish a dashboard.
Power BI report server and power BI service have many similarities and some key differences.
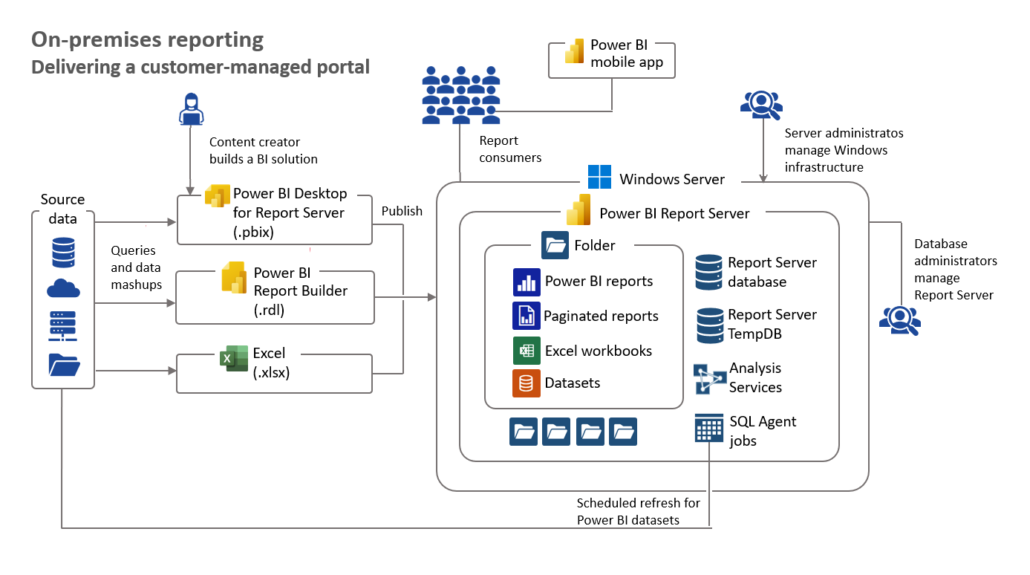
This diagram shows the process flow of creating and publishing a dashboard in the Power BI report Server and Power BI Desktop.
We can create dashboards, reports, and datasets via Power BI desktop, Report Builder, and Excel.
And in the end, publish it in the Power BI Report server.
Power BI report server is an on-premises report server with a web portal in which you display and manages reports and KPIs.
Along with it come the tools to create power bi reports, paginated reports, mobile reports, and KPIs.
First of all, we can create a dashboard via Power BI Desktop and then publish it into the Power BI report server.
And also the end user can have access to the dashboard virtually anywhere.
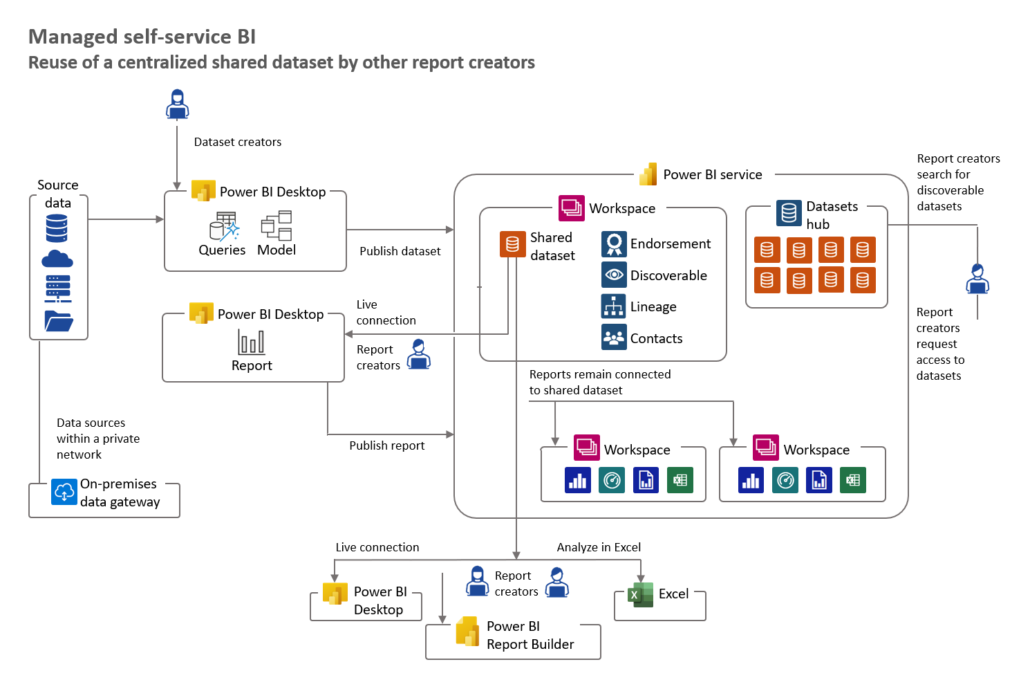
You are viewing the process flow of designing and the publishing dashboard in Power BI Service.
First of all, report creators or dataset creators publish datasets or report into the Power BI service.
Power BI Service consists of many parts such as workspace, and dataset hup.
And in the end, the end user can have access to the dashboard virtually anywhere.
The point is that we can through excel, report builder, and power bi connect to the shared dataset.
In this model, we have a data gateway, data gateway is a connection bridge between the local dataset and shared dataset in the Power BI Service.
One of the most significant of the data gateway is the refreshing dataset.
It’s worth noting that we can design a dashboard Via Power BI service and Power BI Desktop.

I have been working as a senior Business Intelligence Developer such as (Microsoft BI Services, QlikView, Qlik sense, and Power BI) since 2007, what’s more, I have been teaching BI courses such as (QlikView, Qlik Sense, Power BI, and SSRS) for 8 Years.
I want to address that I have been a consultant in various companies such as (Pharmaceutical corporates, port and maritime, insurance companies etc.).
I am capable of covering tasks such as (data cleansing, Designing dashboards, and KPI identification, and also I am well experienced in mentioned fields.
I have studied software engineering for 4 years bachelor’s degree In addition , I have published two books about business intelligence (QlikView with business intelligence approach, organizational key performance indicator)
I have passed the MCT and MCSA courses and I have been qualified for them.


Leave a Reply
Want to join the discussion?Feel free to contribute!